Decision 14/ CP.19, paragraph 3, “agrees that the data and information used by Parties in the estimation of anthropogenic forest-related emissions by sources and removals by sinks, forest carbon stocks, and forest-area changes, as appropriate to the activities referred to in decision 1/CP.16, paragraph 70, undertaken by Parties, should be transparent, and consistent over time and with the established forest reference emission levels and/or forest reference levels in accordance with decision 1/CP.16, paragraph 71(b) and (c) and section II of decision 12/CP.17”.
CO2 emissions from deforestation and forest degradation in Papua New Guinea in the period from 2001 to 2013, used in the construction of the FRL, were estimated using the formula:
Annual emission (tCO2e) = 1,679,607 x Year -3,339,358,085
For this Technical Annex, the REDD+ results for years 2014 to 2015 were calculated using the same approach, simply by subtracting the Total Emissions and Removals value for that period from the FRL 2014-2018 results. However, PNG realised that the linear extrapolation of post-deforestation removals would result in an over-estimation of emission reduction, i.e. an over-estimation of results, therefore it proposed a small correction as explained in section 3.2. So for year t , the reduced emissions from deforestation and forest degradation were as follows:
Hence, the emission reduction in 2014 corresponds to:
43, 369,737 tCO2 – 38, 677,156 tCO2 – 735,170 tCO2 = 3, 957,412t CO2, etc.
The total results achieved by PNG in reducing emissions by REDD+ activities from 2014 to 2015, was the sum of the results achieved for each year of the period shown in Table below.
| Year | FRL emission | Actual emission | Post deforestation correction | REDD+ results |
| (t CO2 eq) |
| 2014 | 43,369,737 | 38,677,156 | 735,170 | 3,957,412 |
| 2015 | 45,049,344 | 39,024,003 | 979,439 | 5,045,902 |
Total REDD+ result achieved by PNG in 2014 and 2015 = 3,957,412 tCO2 + 5,045,902 tCO2 = 9,003,314 tCO2

REDD+ Results 2014-2015 (against the Linear Projected FRL)
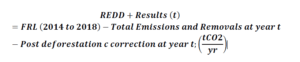
The REDD+ results for the years 2014 to 2015 were assessed against the recalculated historical average FRL of 5-year (2009-2013) Historical Average plus 0.02% of total carbon stock in 2013. The following formula was applied to calculate the REDD+ results:
REDD+ results (t) = FRL (Historical Average + 0.02% of total C Stock) 2014 to 2018 – Total Emissions and Removals at year t; (tCO2/yr.)
Thus, REDD+ results achieved by Papua New Guinea in 2014 and 2015 against the historicalaverage FRL is calculated as follows:
(i) 2014: 42,172,324 tCO2 – 38,677,156 tCO2= 3,495,169 tCO2
(ii) 2015: 42,172,324 tCO2 – 39,024,003 tCO2 = 3,148,321 tCO2
Total REDD+ results achieved by PNG in 2014 and 2015 against the Historical Average FRL=3,495,168 tCO2 + 3,148,321tCO2 = 6,643,490 tCO2
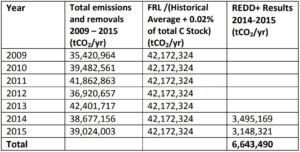
REDD+ Results 2014-2015 (against the Historical Average FRL)